
How to get insights from glucose data with Python
Using Python and common sense to understand glucose data

Perhaps, this last experiment shows that tracking your glucose is a good excuse to eat ice cream for the sake of “science”. But outside of that there is a lot more one can learn from (I will share these separately soon, so make sure you subscribe if you’re interested). Unfortunately, all the tools out there are built on top of old workflows focused on treatment and are useless for healthy individual data.
To make this process easier for others, including myself, I published glyco the first Python library for understanding glucose data, and in this post I’ll show you exactly how you can use it to:
Read, clean and describe glucose data.
Understand how meals, activities or other events affect glycemic variation.
Compare different days, check your glucose during sleep, and a lot more.
glyco is meant for “healthy” individuals. This distinction is important because when you check data from people who do not have diabetes, the analysis is more subtle than just being in a pre-defined range:
You may need to compare different meals or supplements to each other.
You may want to compare it to the overall population.
And traditional glucose analysis methods do not handle this well, as they are built on top of old heuristics. But all of this and much more is possible if you use glyco.
Analyze glucose data with Python
If you prefer practicing on a notebook, you can check the glyco Getting Started guide here as a Colab notebook. The goal of this article is to simultaneously explain the thought process behind analyzing glucose data along with how to do it. glyco uses pandas notebooks which makes it easy to integrate into your other workflows, so that you can use other tools that you prefer and only use the features that interest you in glyco.
Installation is as simple as installing any Python library, you can use pip or your favorite dependency handler. glyco is available on pypi, and the github repo can be found here.
pip install glycoStep 1 - Read and describe different types of data
Glucose data can come from different sources (CSV, TSV files, structured data in tables etc.) but it also can have different formats, for example:
Sometimes the date can be formatted in different ways
Sometimes the glucose is in mmol/L other times in mg/dL
glyco handles those different sources and different formats by design.
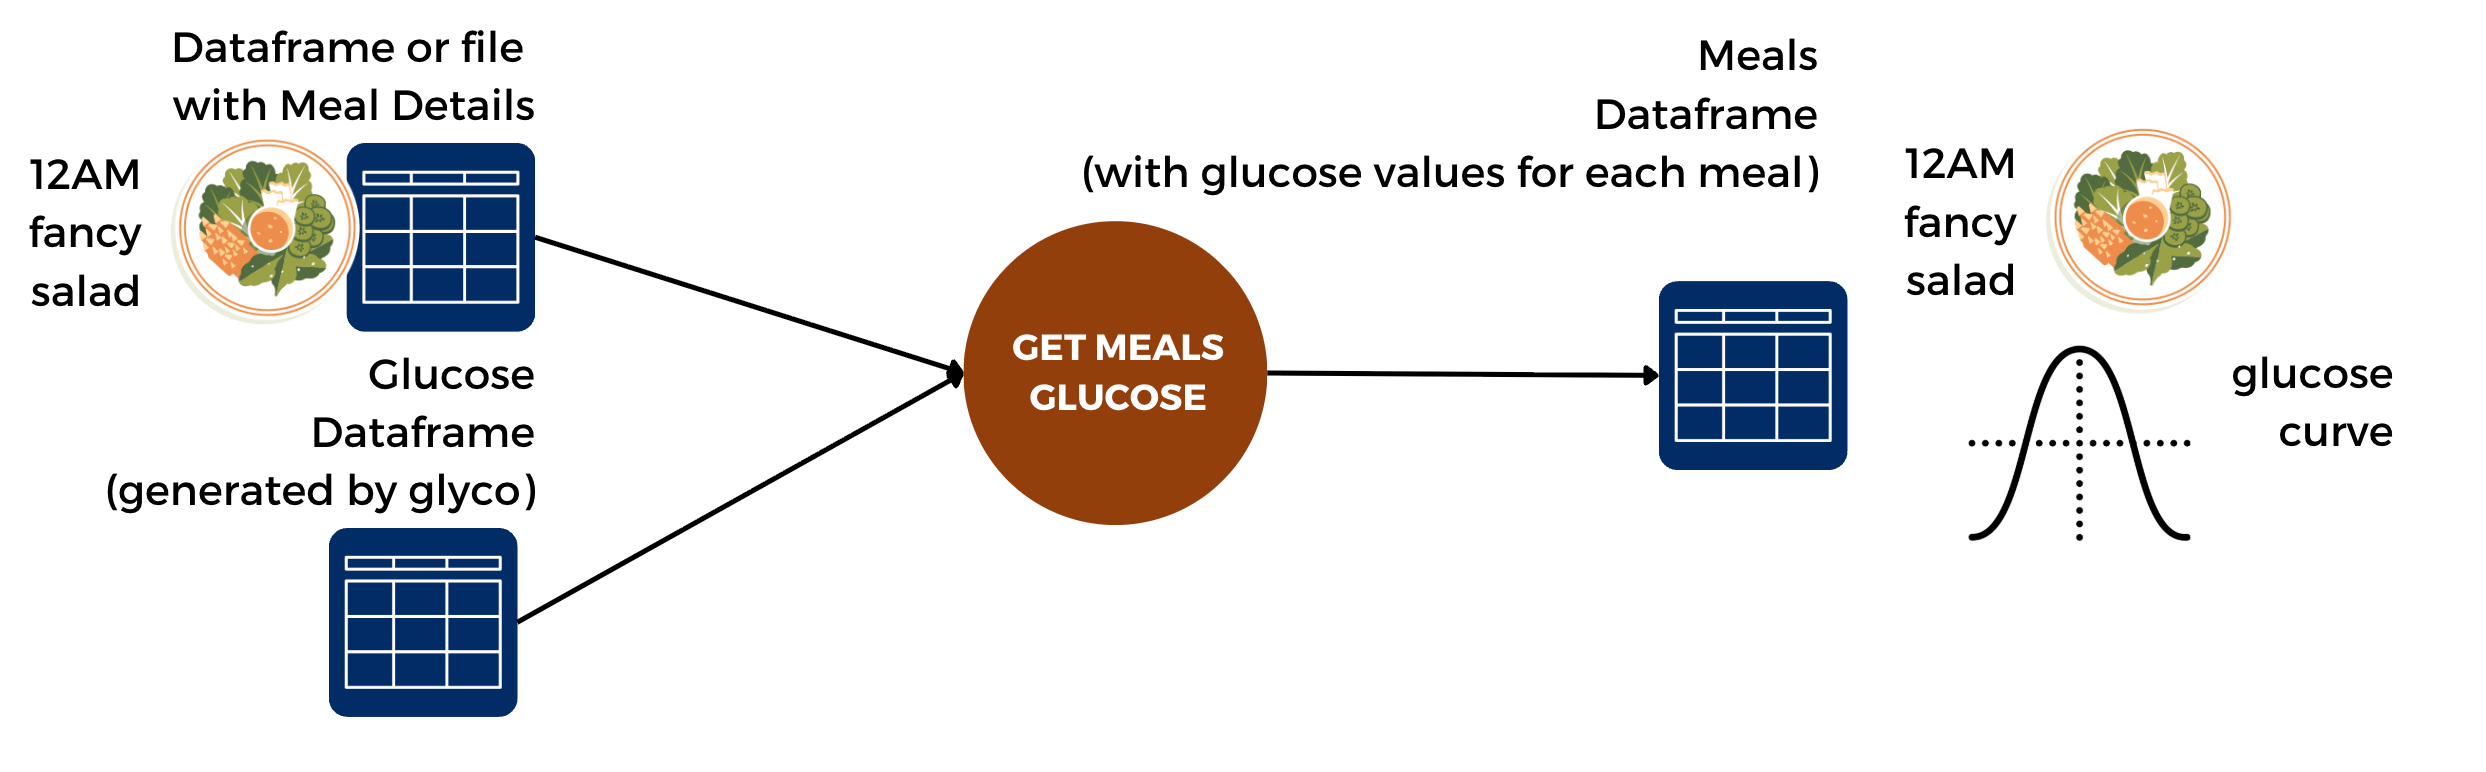
Here’s what the flow looks like in glyco:
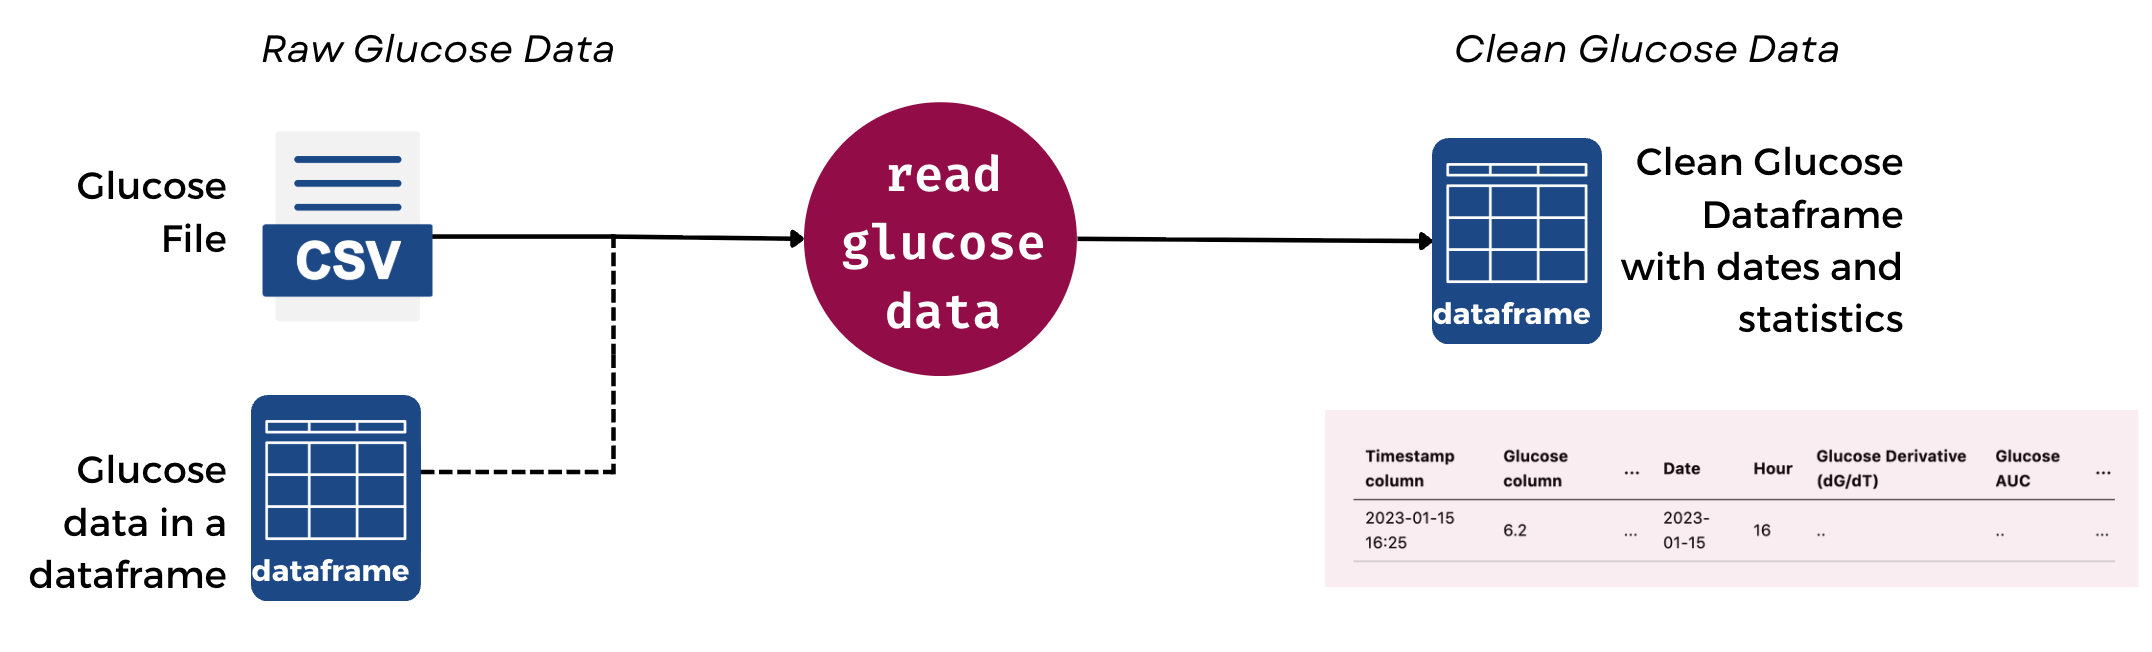
This means that your data is immediately cleaned and processed.
Extra note on Privacy and de-identifying glucose data: there’s also a privacy feature that allows you to hide or hash certain columns, shift dates or even add noise to the data so that it cannot be identified. More on this in the github page here.
Let’s try reading sample CGM data from the repository :
import glyco as gl

file_path = 'data/out_glucose_sample.csv'
glucose = gl.read_csv(file_path)
Now glucose will be a pandas dataframe containing multiple columns that are automatically generated by glyco. These include: the timestamp, glucose, time and date columns (including the day, hour, week number etc.), and other values used for calculating metrics. You can read more in the docs here.
But for other types of data you may need to skip rows, have other names for the timestamp column, handle different units etc. This is also possible as shown below:
# Example with all the above
from glyco.utils import Units

glucose = gl.read_csv(file_path,
                    skiprows=0,
                    timestamp_col= “Device Timestamp”,
                    glucose_col= “Historic Glucose mmol/L”,
                    glucose_unit=Units.mmolL.value,
                    timestamp_fmt=”%d-%m-%Y %H:%M”
                )

# display the first two glucose rows
glucose.head(2)
You can even autodetect units so you don’t have to define the unit by yourself:
glucose = gl.read_csv(file_path=file_path, unit_autodetect=True)Now, let’s have glyco describe to us what this data contains:
gl.describe_glucose(glucose)This will output the following:
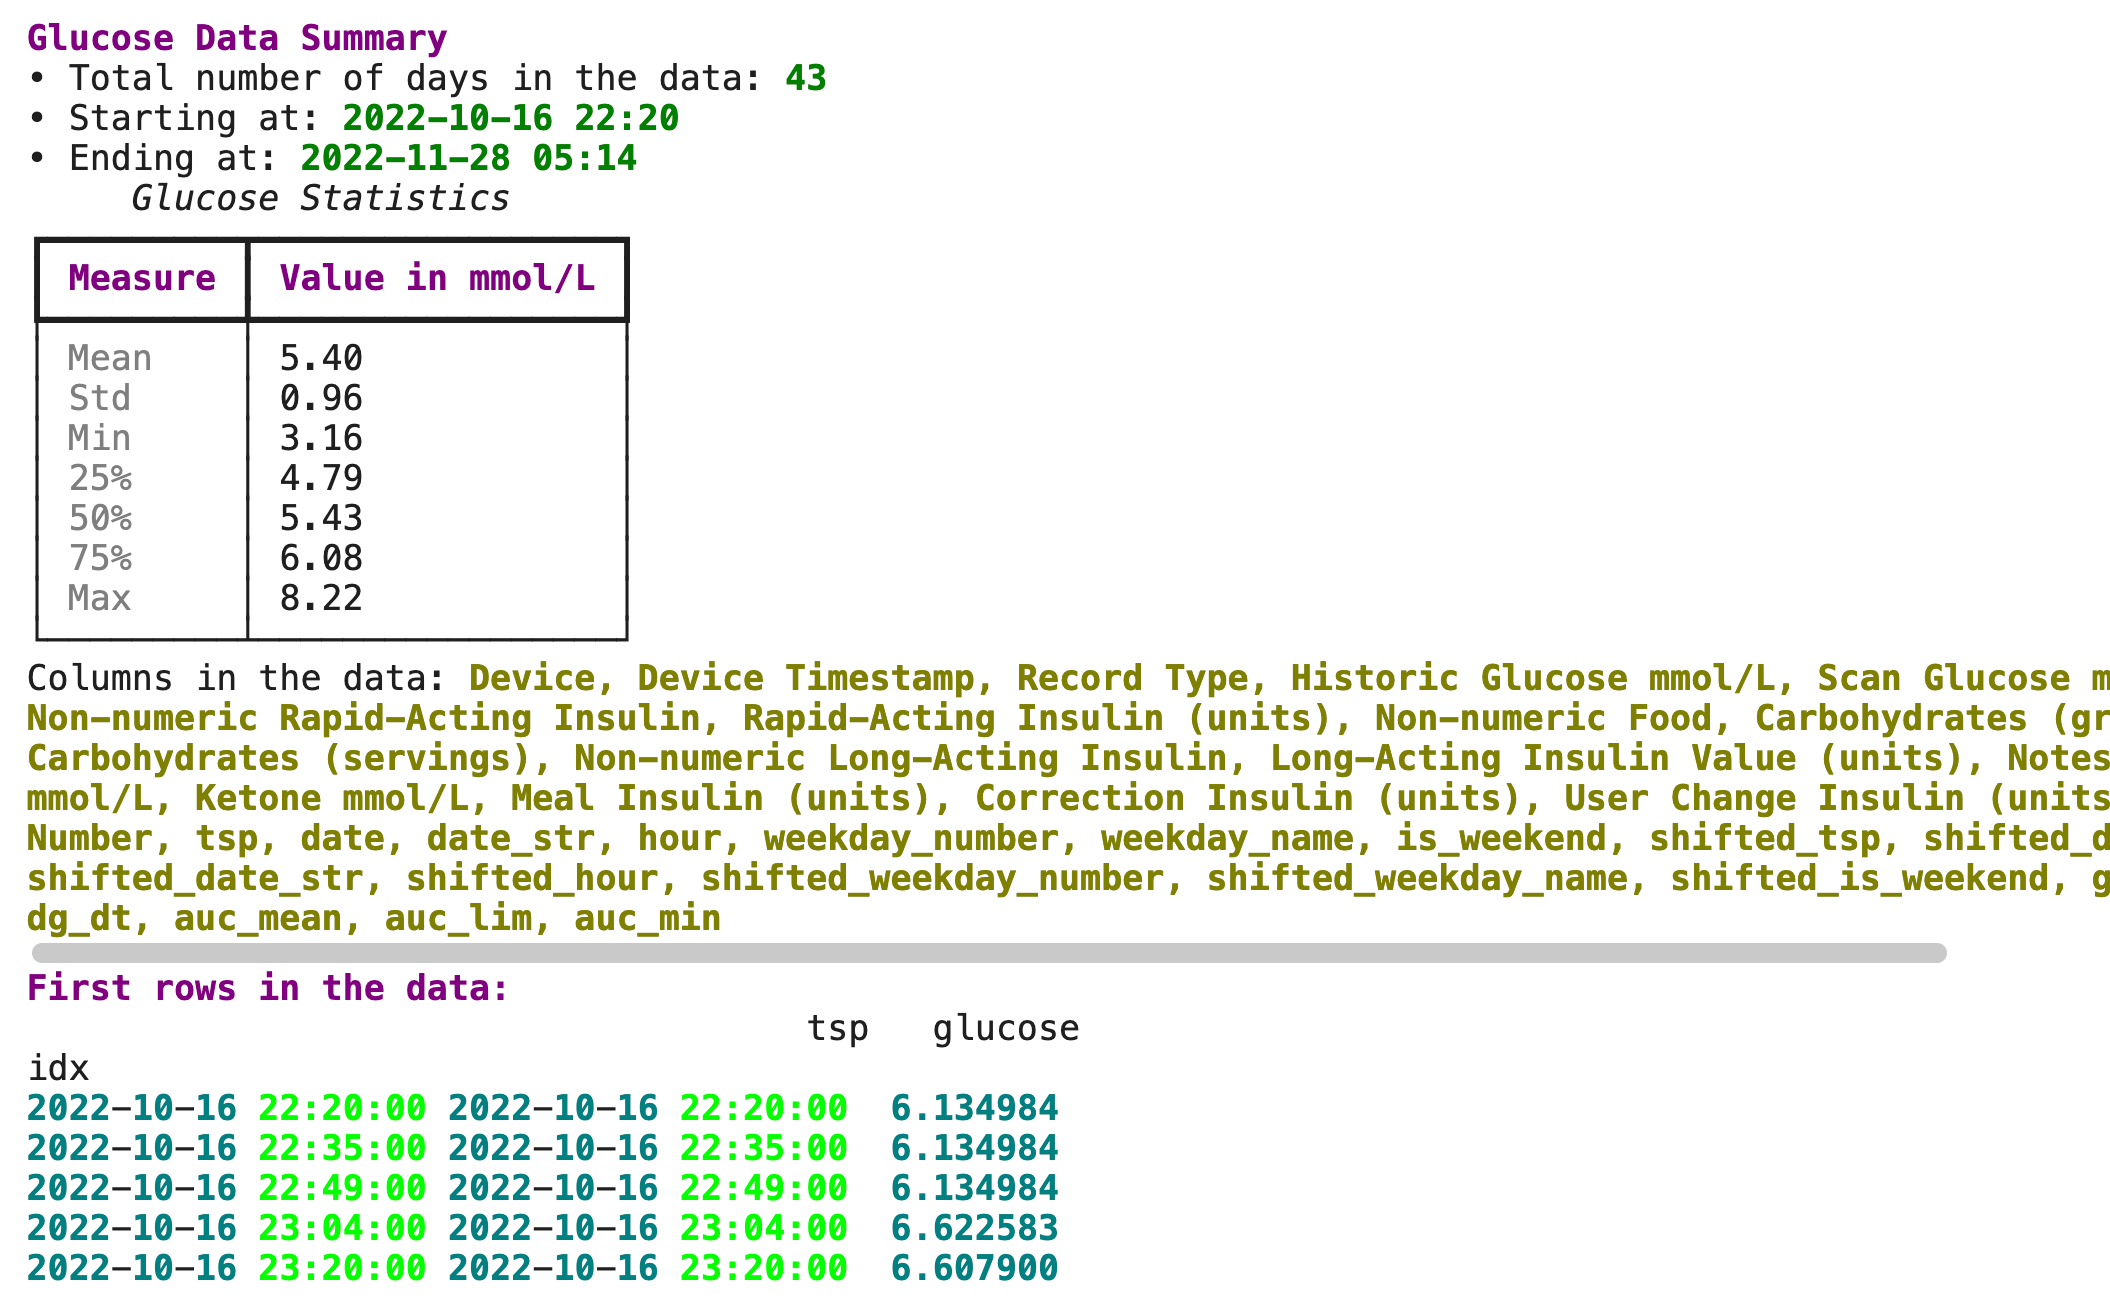
As you can see, glyco uses the rich library for nicer displays. And shows some basic statistics. But in order to dig a bit deeper let’s do some Exploratory Data Analysis on glucose data.
Step 2 - Dig deeper: plotting, metrics and descriptive statistics for glucose data
Plotting a glucose dataframe generated in the step above is as simple as:
gl.plot_glucose(glucose)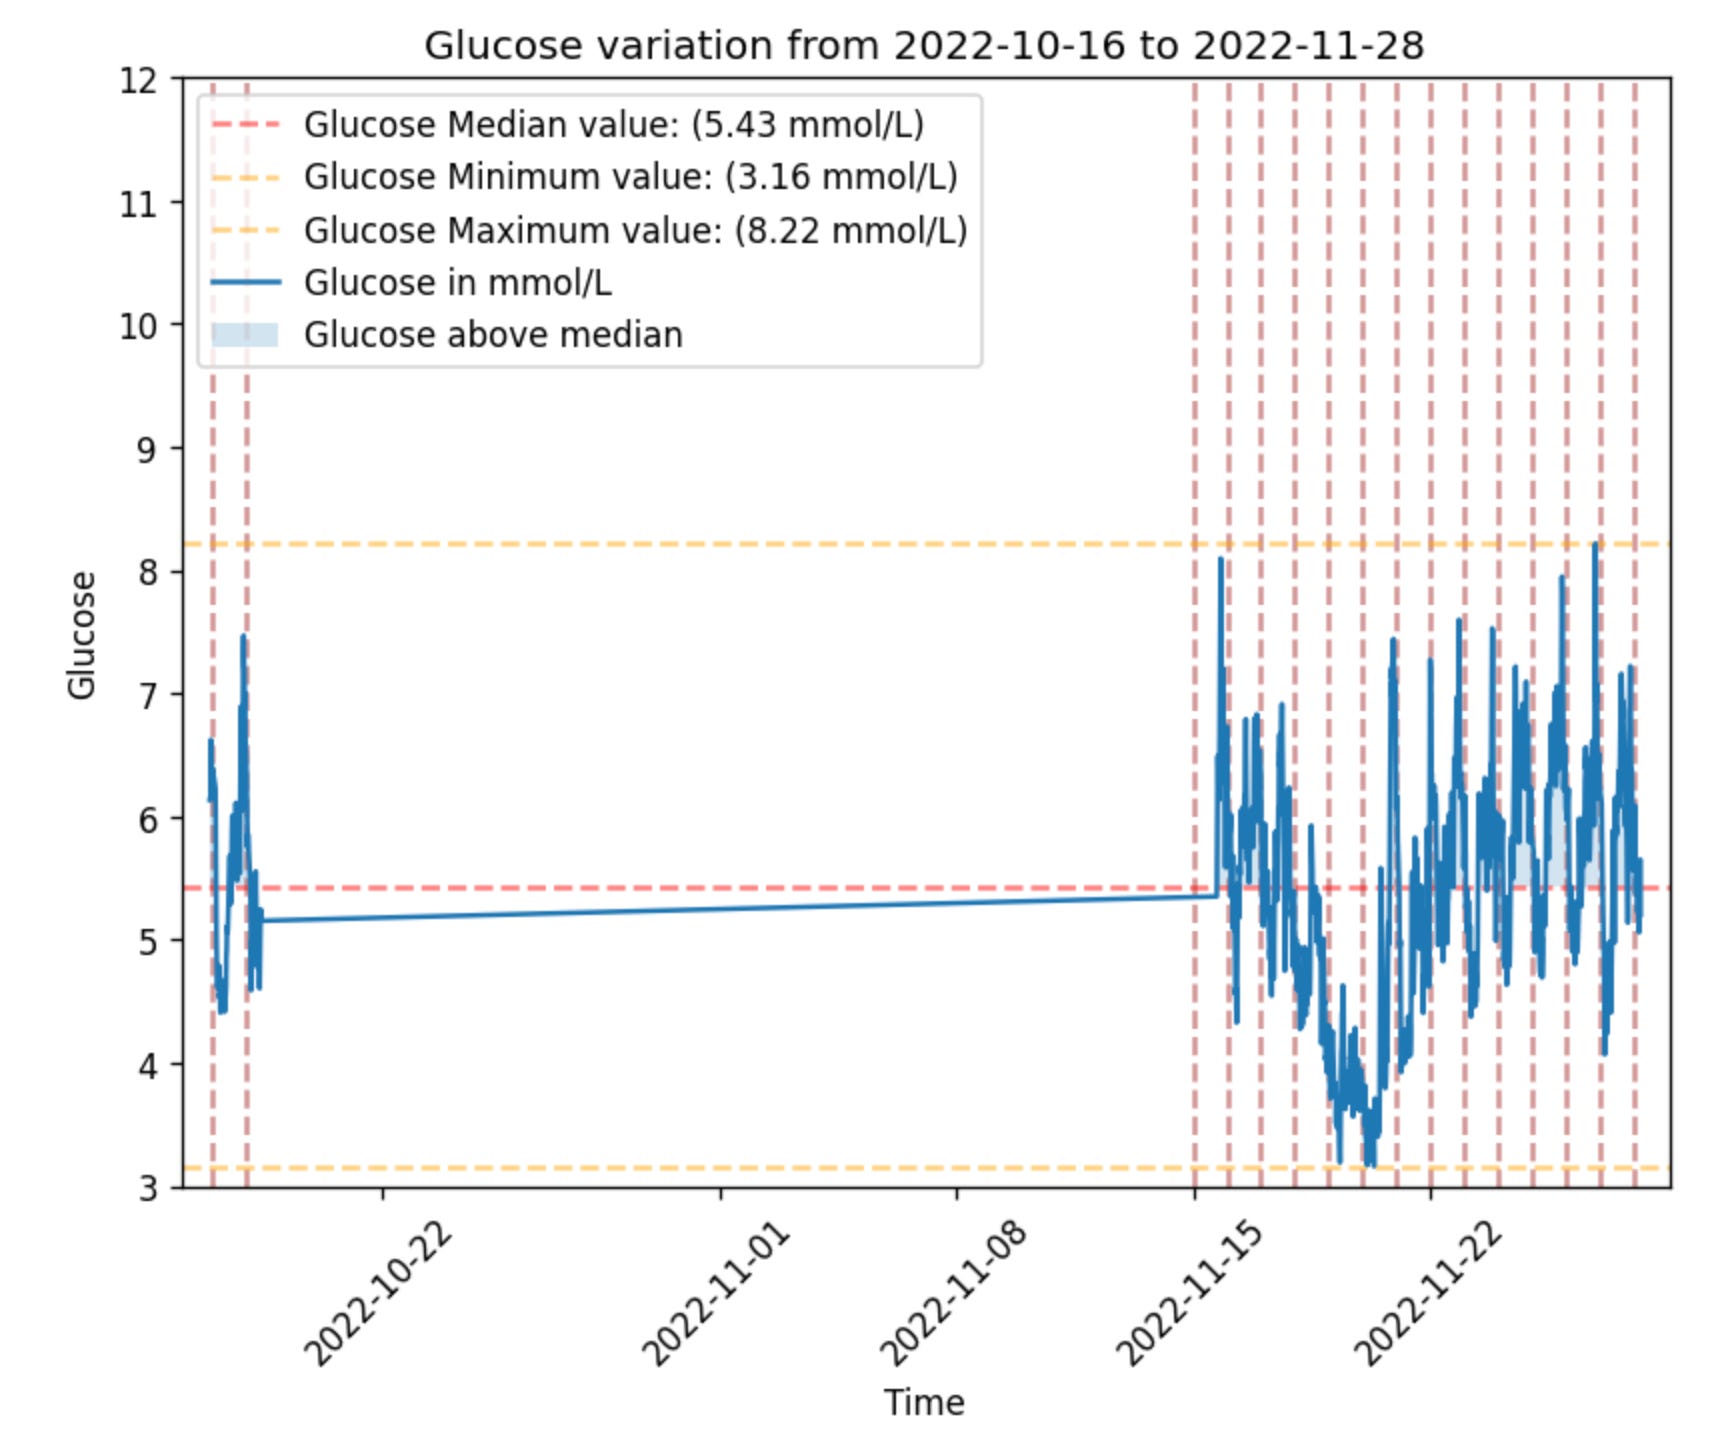
Now let’s only select the data after 2022-11-17 so that we get a closer look:
gl.plot_glucose(glucose, from_time='2022-11-17')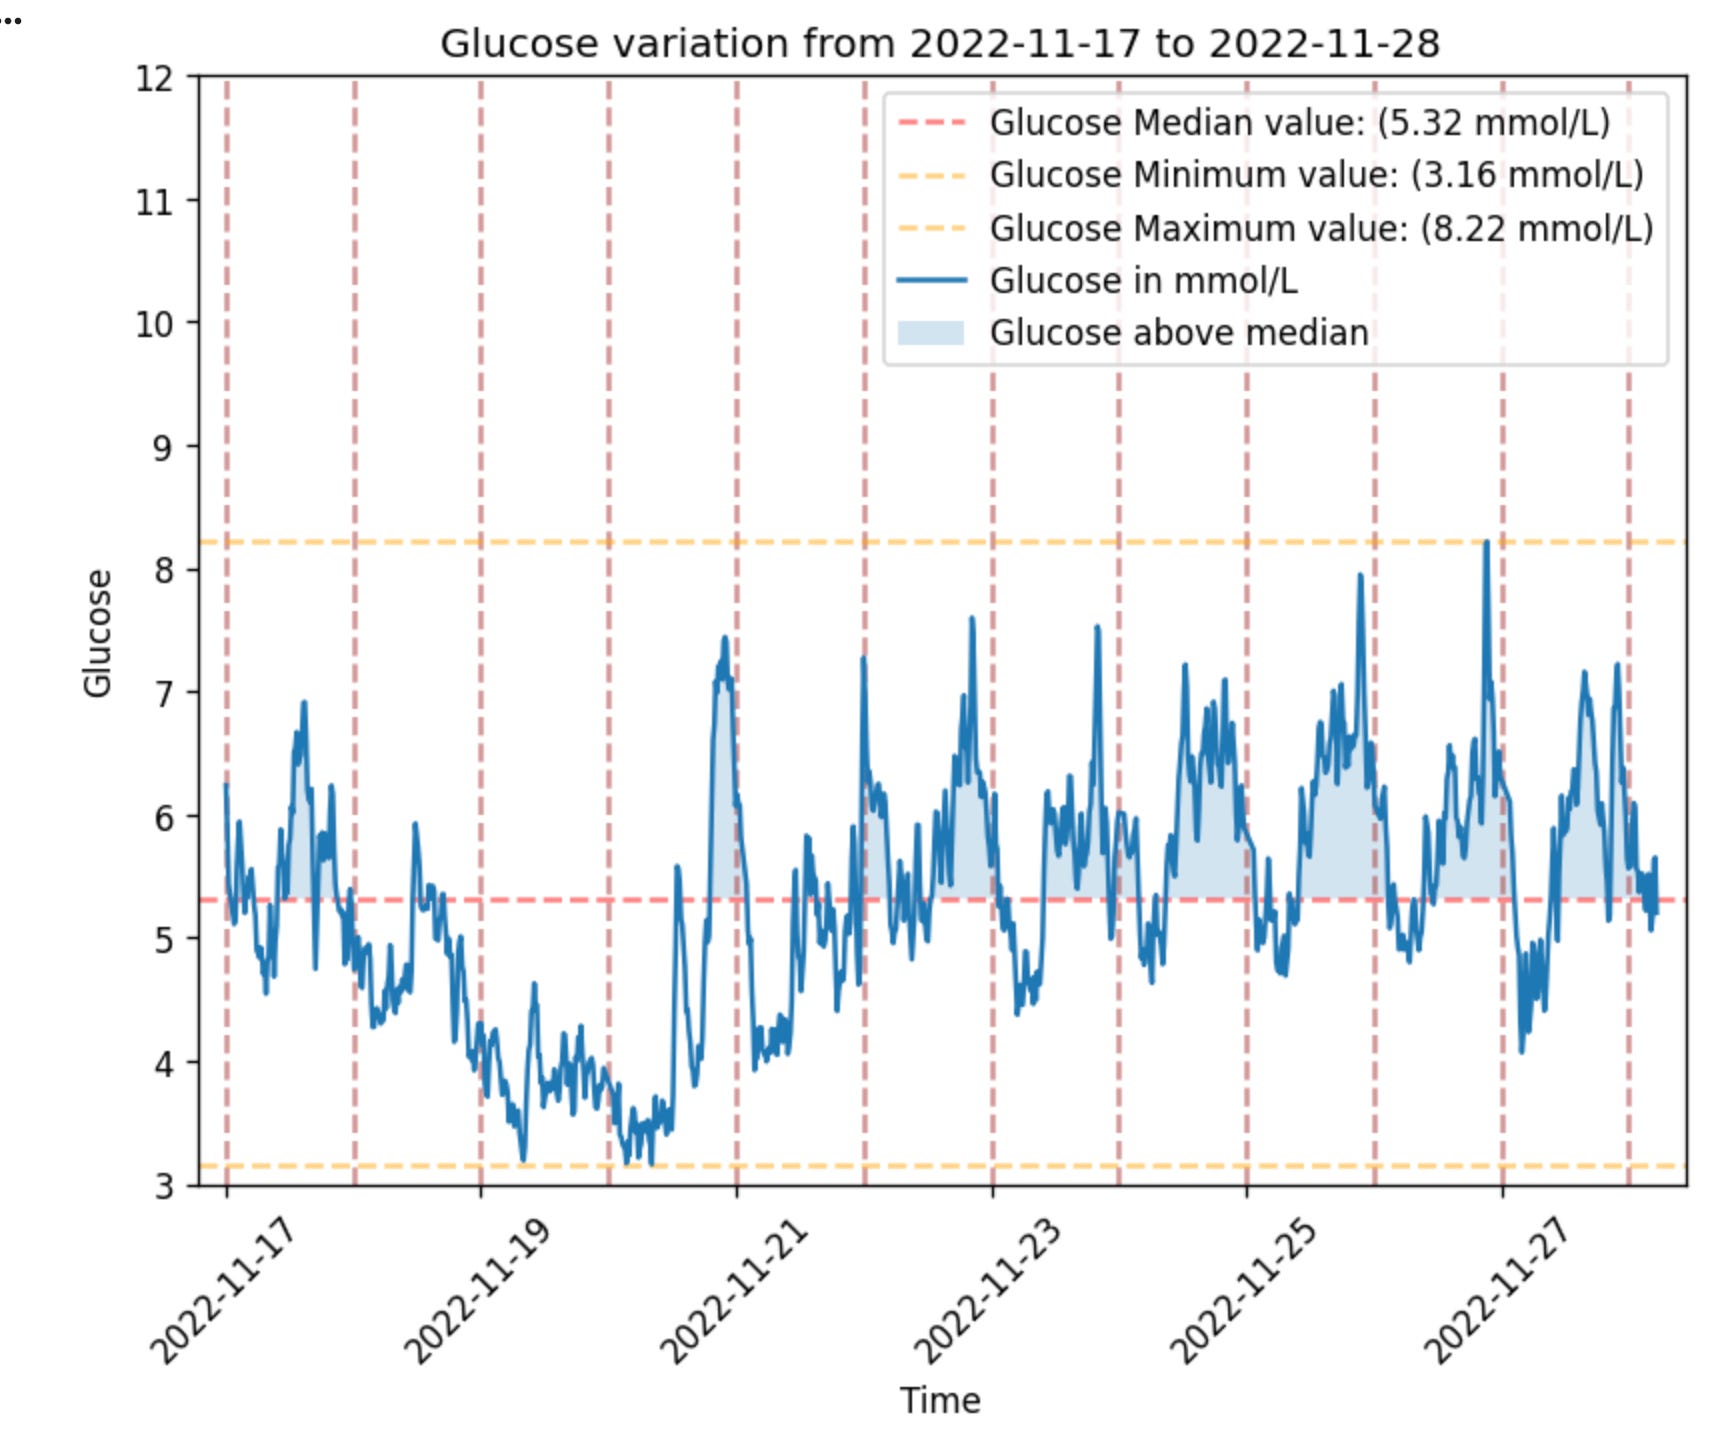
Ok, this is fine for having a look and can be used for digging into a specific day or hours. But what if we want to ask the questions:
How does this individual’s glucose change generally over the span of a day?
How does it change from one day to another?
How do weekend compare to weekdays?
Or specific experiments like how do days with berberine as a supplement compare to days without taking berberine as a supplement?
Well, glyco has a few helper plotting functions that enable you to do exactly that. Such as:
gl.plot_trend_by_hour(glucose)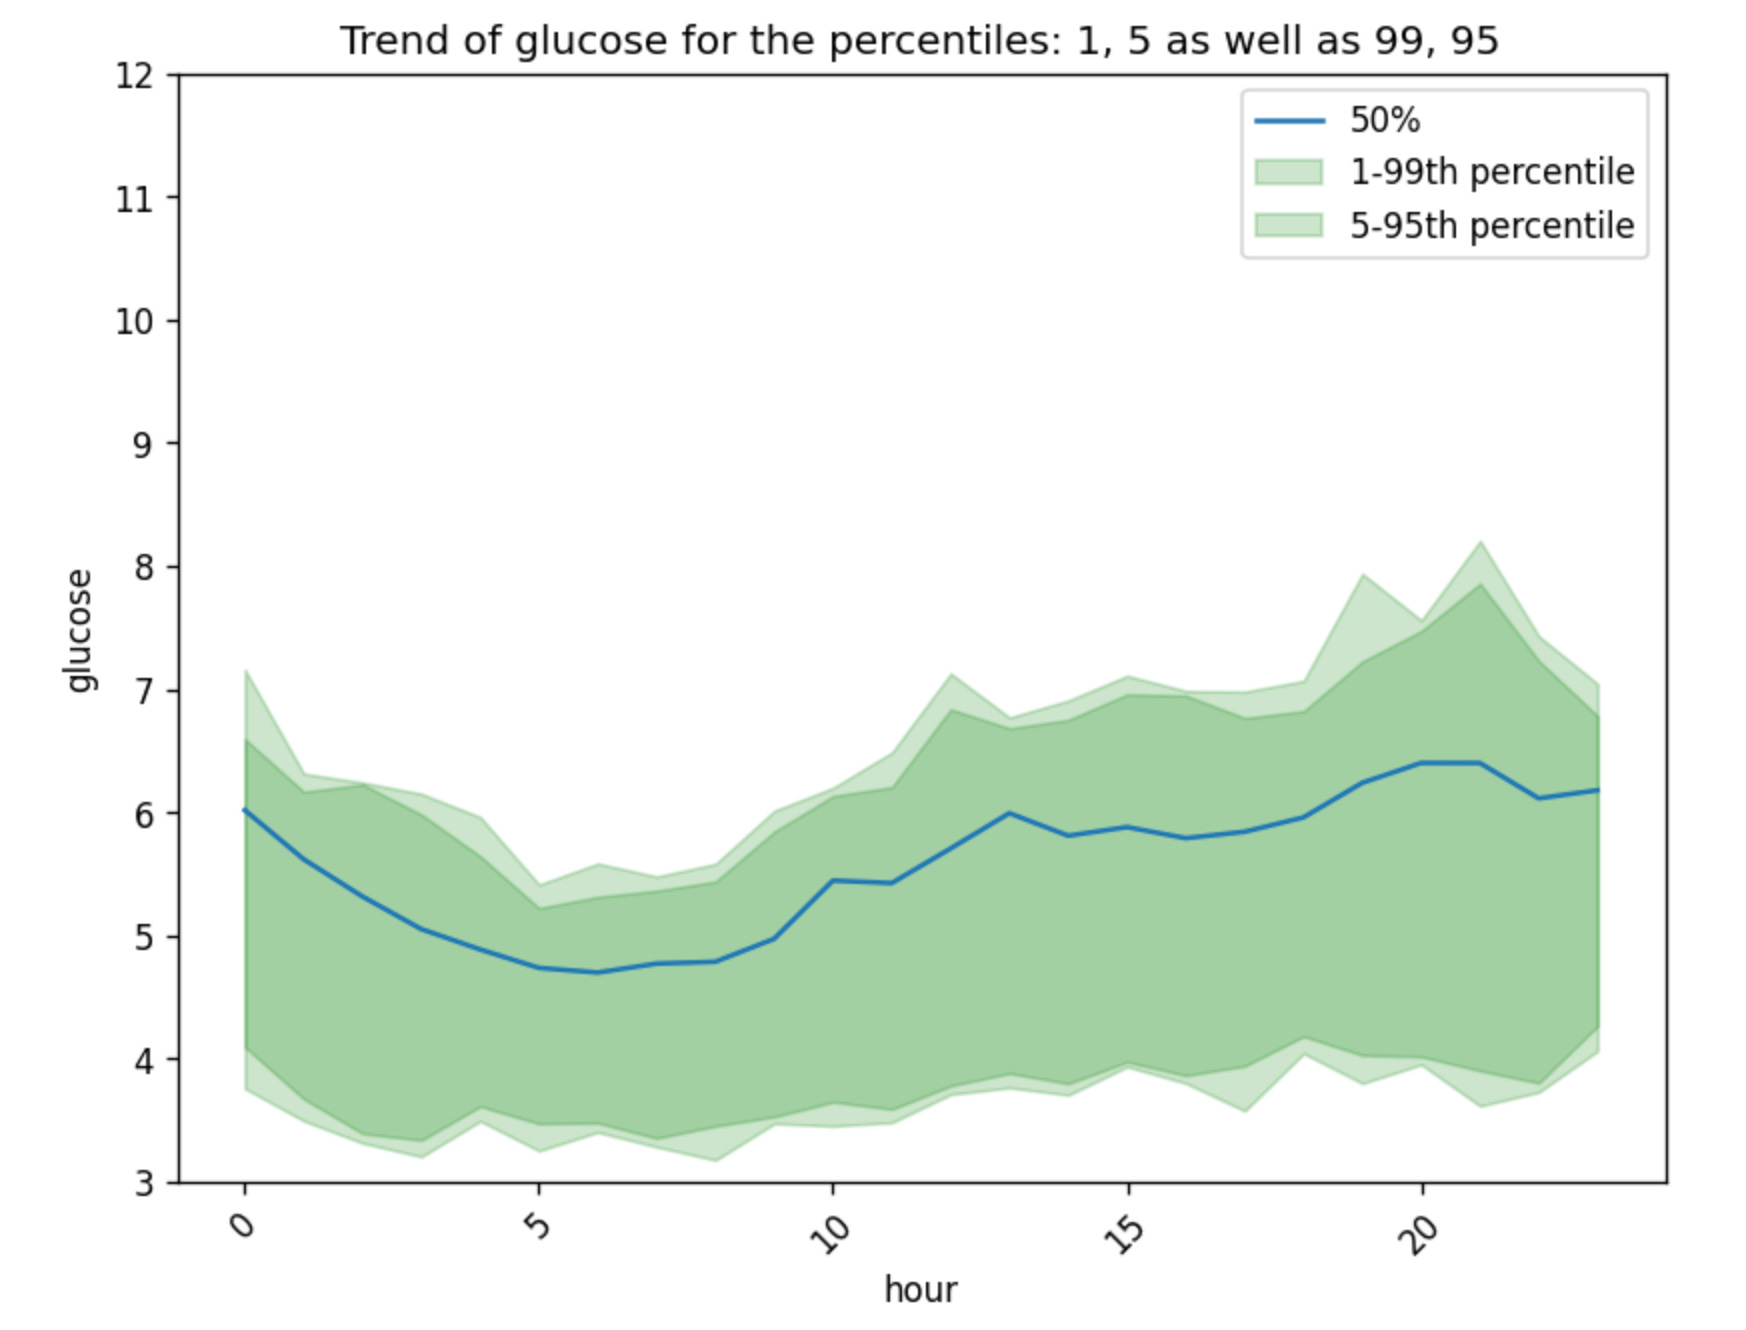
Note that glyco uses
autoplothere which makes the plot look better (rotates the x-axis, adds legend etc.), you can disable this by addingautoplot=Falseas input to the plotting functions. This would be useful if you have your own way of plotting or if you are plotting on specific figures you define.
We can also plot the trend by weekday or by specific columns that we have in our data:
gl.plot_trend_by_weekday(glucose)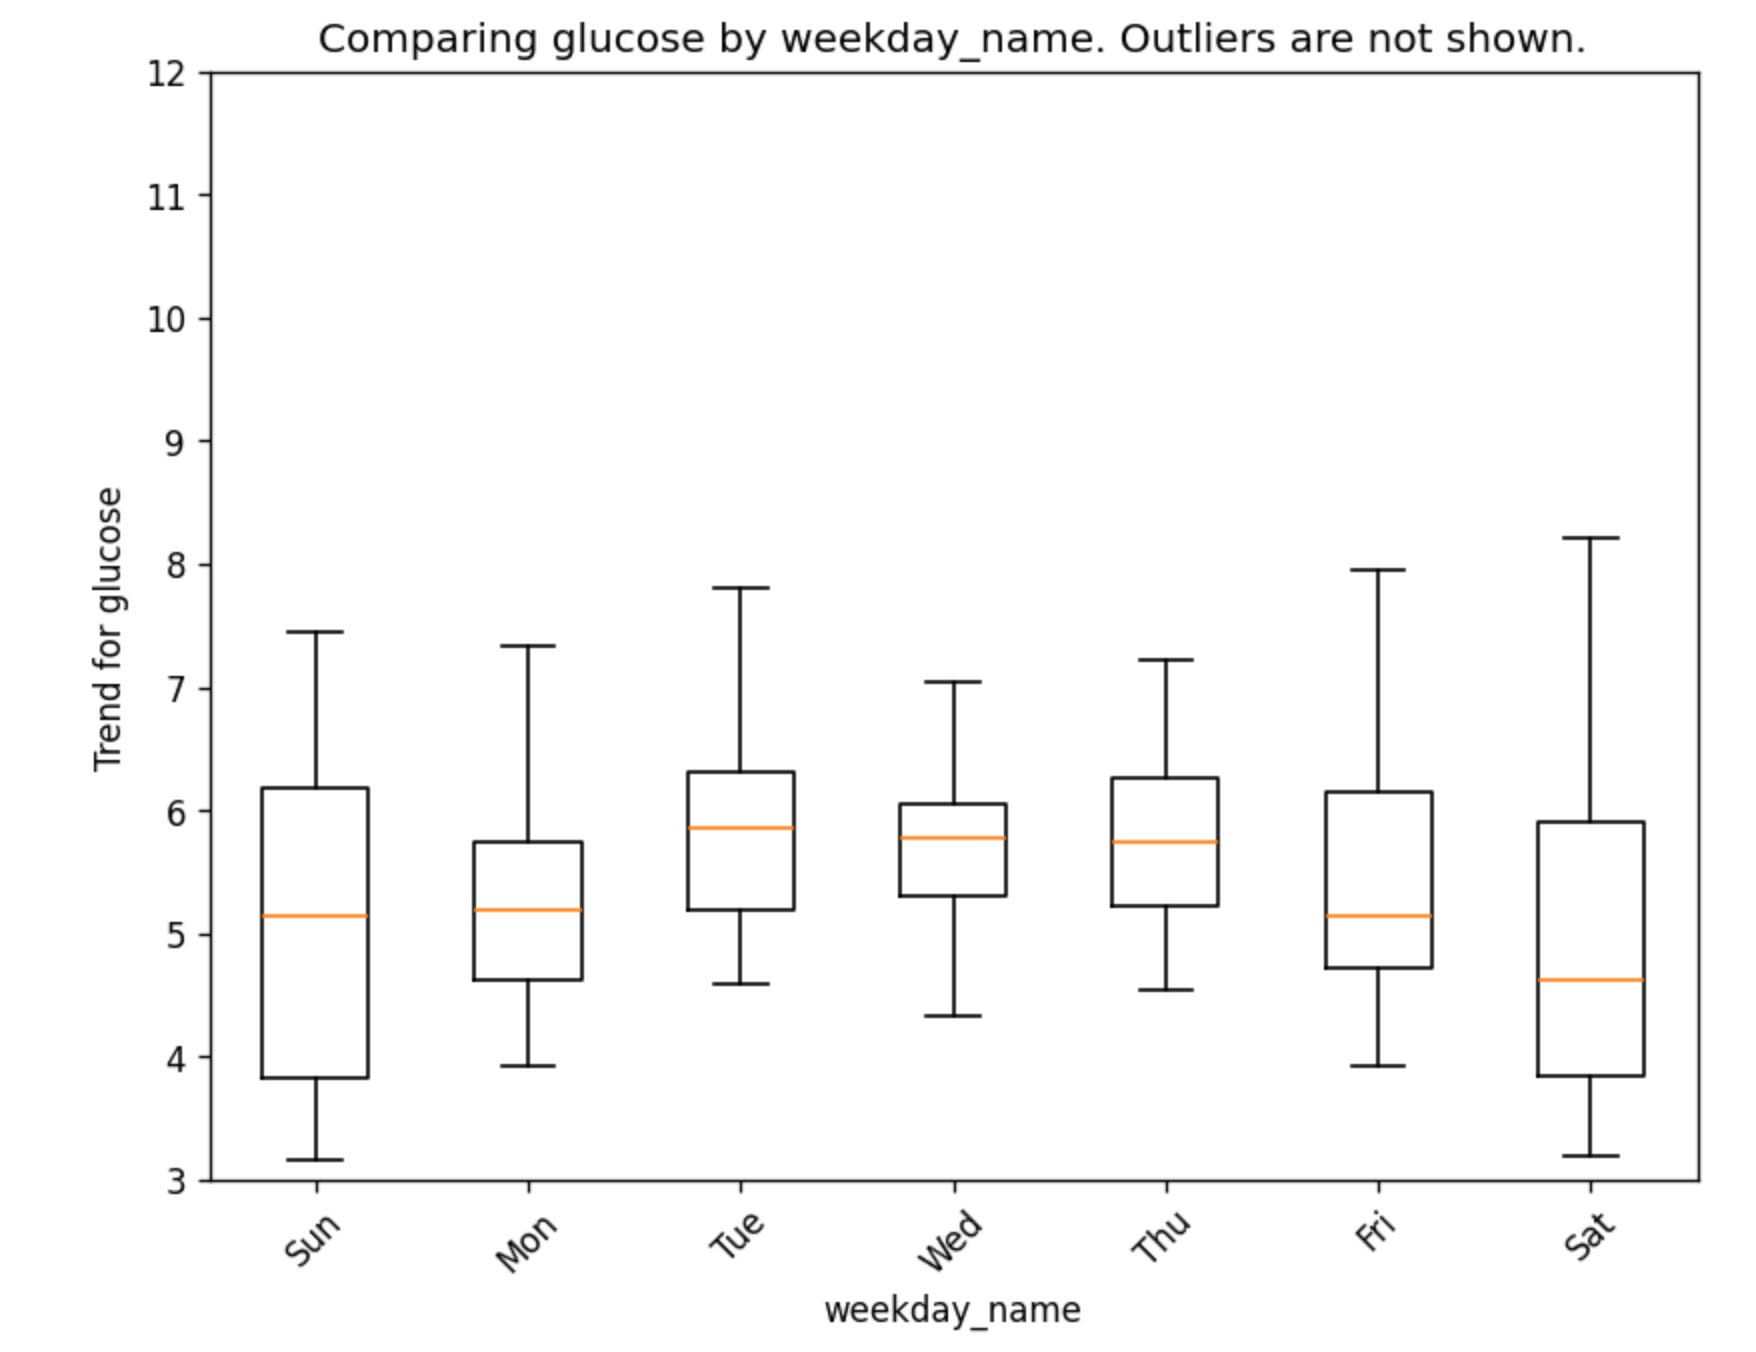
It is also possible to compute a broad set of glucose metrics for comparing meals, days, or other event windows. You can dig further by looking at the metrics that glyco generates here. They basically fall into six groups:
Core descriptive stats: mean, median, standard deviation, coefficient of variation, min, peak, delta (peak minus min), and incremental peak (peak above baseline).
Timing: time-to-peak and time-to-baseline (recovery time).
Incremental AUC: area above baseline over a 2h window, a 4h window, and the full session. Captures both magnitude and duration of elevation.
Time-in-range: time-weighted minutes and percentages in range (3.9–10.0 mmol/L), above range (>10.0 and >13.9), and below range (<3.9 and <3.0).
Dynamics: max rise rate and max fall rate, in mmol/L per minute.
Variability indices: an approximate MAGE (mean amplitude of large excursions) and a lability index for rapid, jagged swings.
The next section will be on meals and activities, those also have their metrics calculated in glyco, these five give you the clearest picture of a meal response:
Incremental peak how high the spike went above your starting point.
iAUC (2h or 4h) total exposure, combining height and duration.
Time above 10 mmol/L (%) how long you spent in hyperglycemic territory.
Time-to-baseline how quickly you recovered.
Max rise rate how steep the climb was.
Step 3 - Analyze meal responses and other activities that affect glucose
glyco has a general way to handle meals and activities that affect glucose (such as exercise, supplements, taking a sauna, cold bath etc.).
All of these are handled as events, so an event can be a meal or an activity etc.
Then glyco has another concept called event sessions which is just a series of events that are close in time bundled together (for example: you eat a snack and go for a walk to the gym and exercise there)
For the purposes of this tutorial, to make things simple we will focus on just meals, and a session in this case will be multiple meals eaten close in time to each other.
The data for meals that glyco can use should contain:
(required) time of the meals.
(optional) name of the meal or other type of reference (such as notes taken etc.)
To analyze meal data you can use meals from either: a csv file, A pandas dataframe with meals, if the data is from FreeStyle libre you can get these directly from the Notes or the record type column.
meals = gl.read_events_csv('data/out_meals.csv', tsp_col='meal_datetime', ref_col='meal_notes', timestamp_fmt='%Y-%m-%d %H:%M:%S')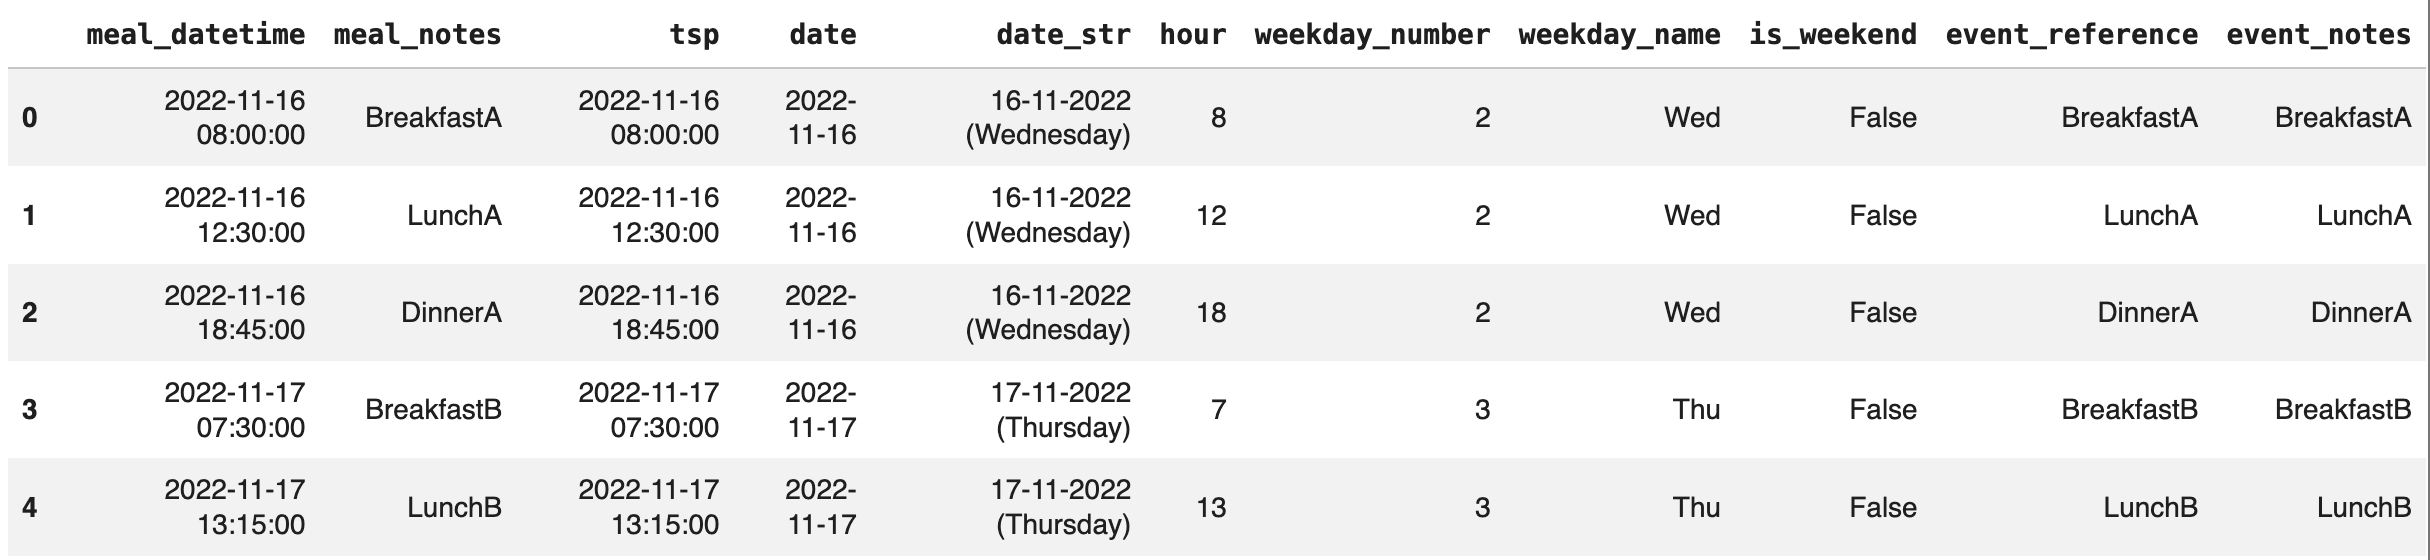
If you do not have any recorded events, glyco can also:
Autodetect meals by looking at the glycemic variation (of course, it would only detect events that affect glucose enough in this case, so drinking a cup of olive oil is unlikely to show up using this feature)
Read meal and event columns recorded in Freestyle Libre or other CGM devices.
To generate the meals dataframe you also need the glucose dataframe. This is because the meals dataframe contains information about the glucose responses as well.
One core philosophy of glyco is that the analysis should happen at the level of a meal session (or an event session in general).
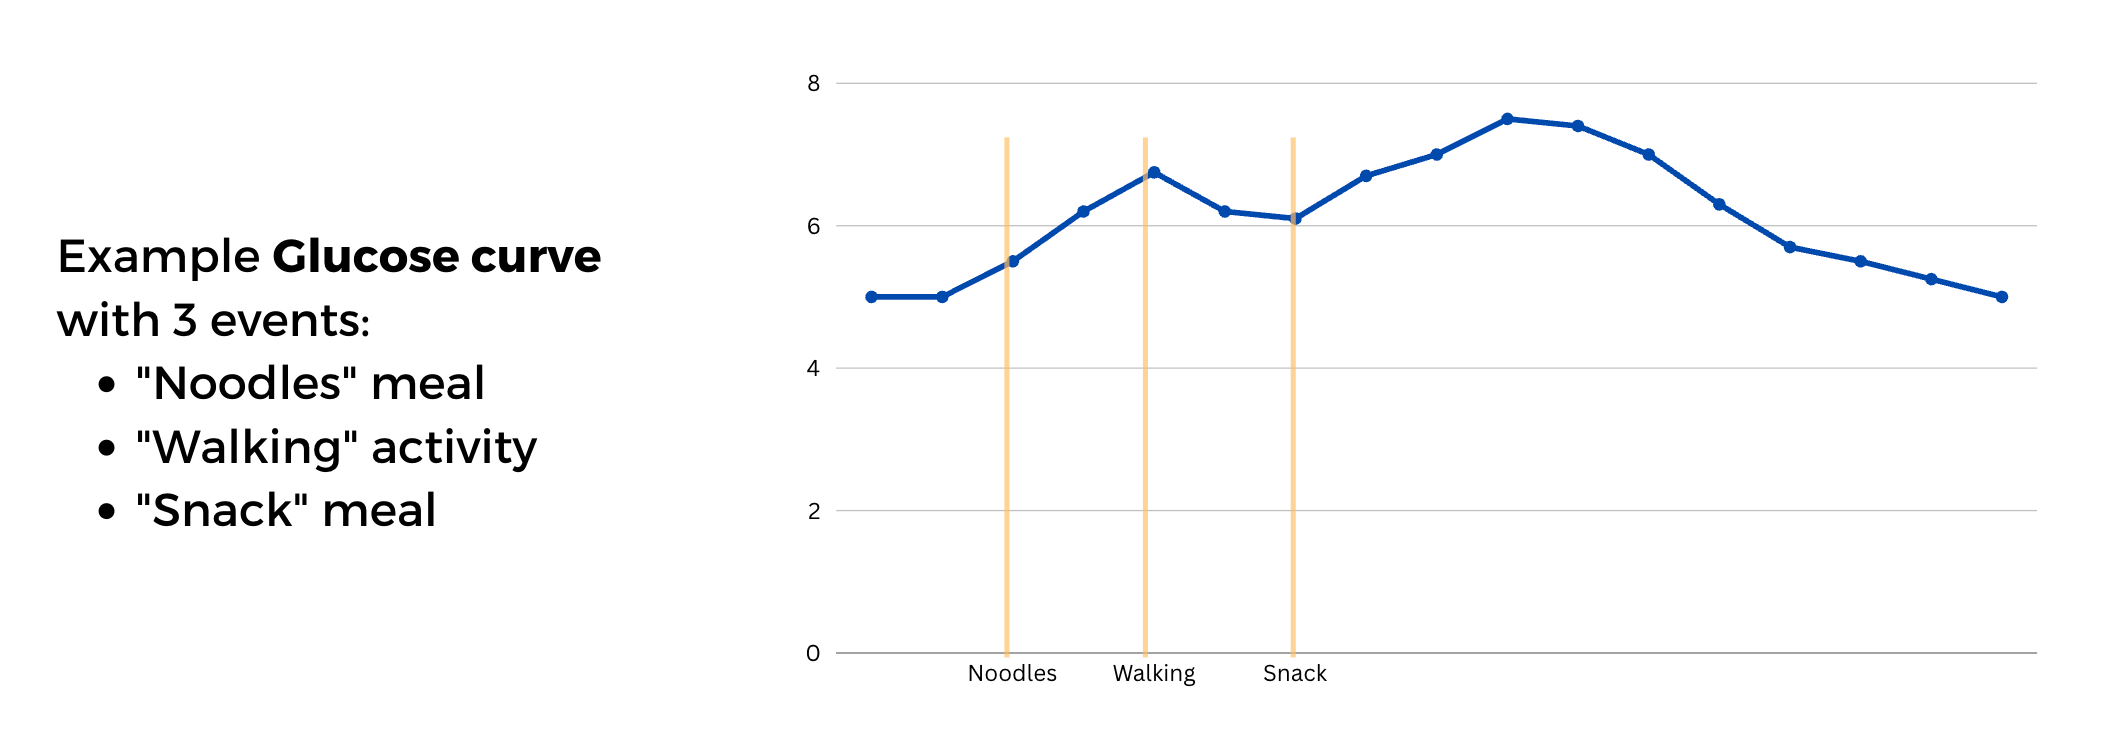
In the figure above, “Noodles, walking, snack” are separate events, but can be seen as one session.
To explain this a bit, think about the following scenarios:
You eat a cake at 12:00, and then another cake at 12:15
You eat half of a cake at 12:00 and half of it at 15:00
You eat two cakes at 12:00
Which ones of these count as different meals, which ones count as the same meal.
glyco solve this cake dilemma with a simple rule:
We define a session length, for example: 1h
All events recorded that are separate by 1h or less will be grouped in the same meal session.
So if you recorded cakeA and cakeB 15min apart, glyco will gather them in one meal session. However, the issue that may happen is if you have eaten so many meals that are less than 1h apart. This means glyco will consider that you have had one meal session on that day. But this makes sense because we cannot fully separate the responses for those meals. And while this scenario is not very realistic, glyco allows you to define your own session length. Which means that if you define a session length of 30min, meals eaten 40min apart will be taken as different sessions.
If none of this makes sense, drop me a comment and I’ll reply with a clearer explanation asap.
But let’s take a look at what the sessions look like in this case
meal_sessions = gl.get_event_sessions(meals, glucose, event_tsp='tsp')And let’s only look at the last columns here:
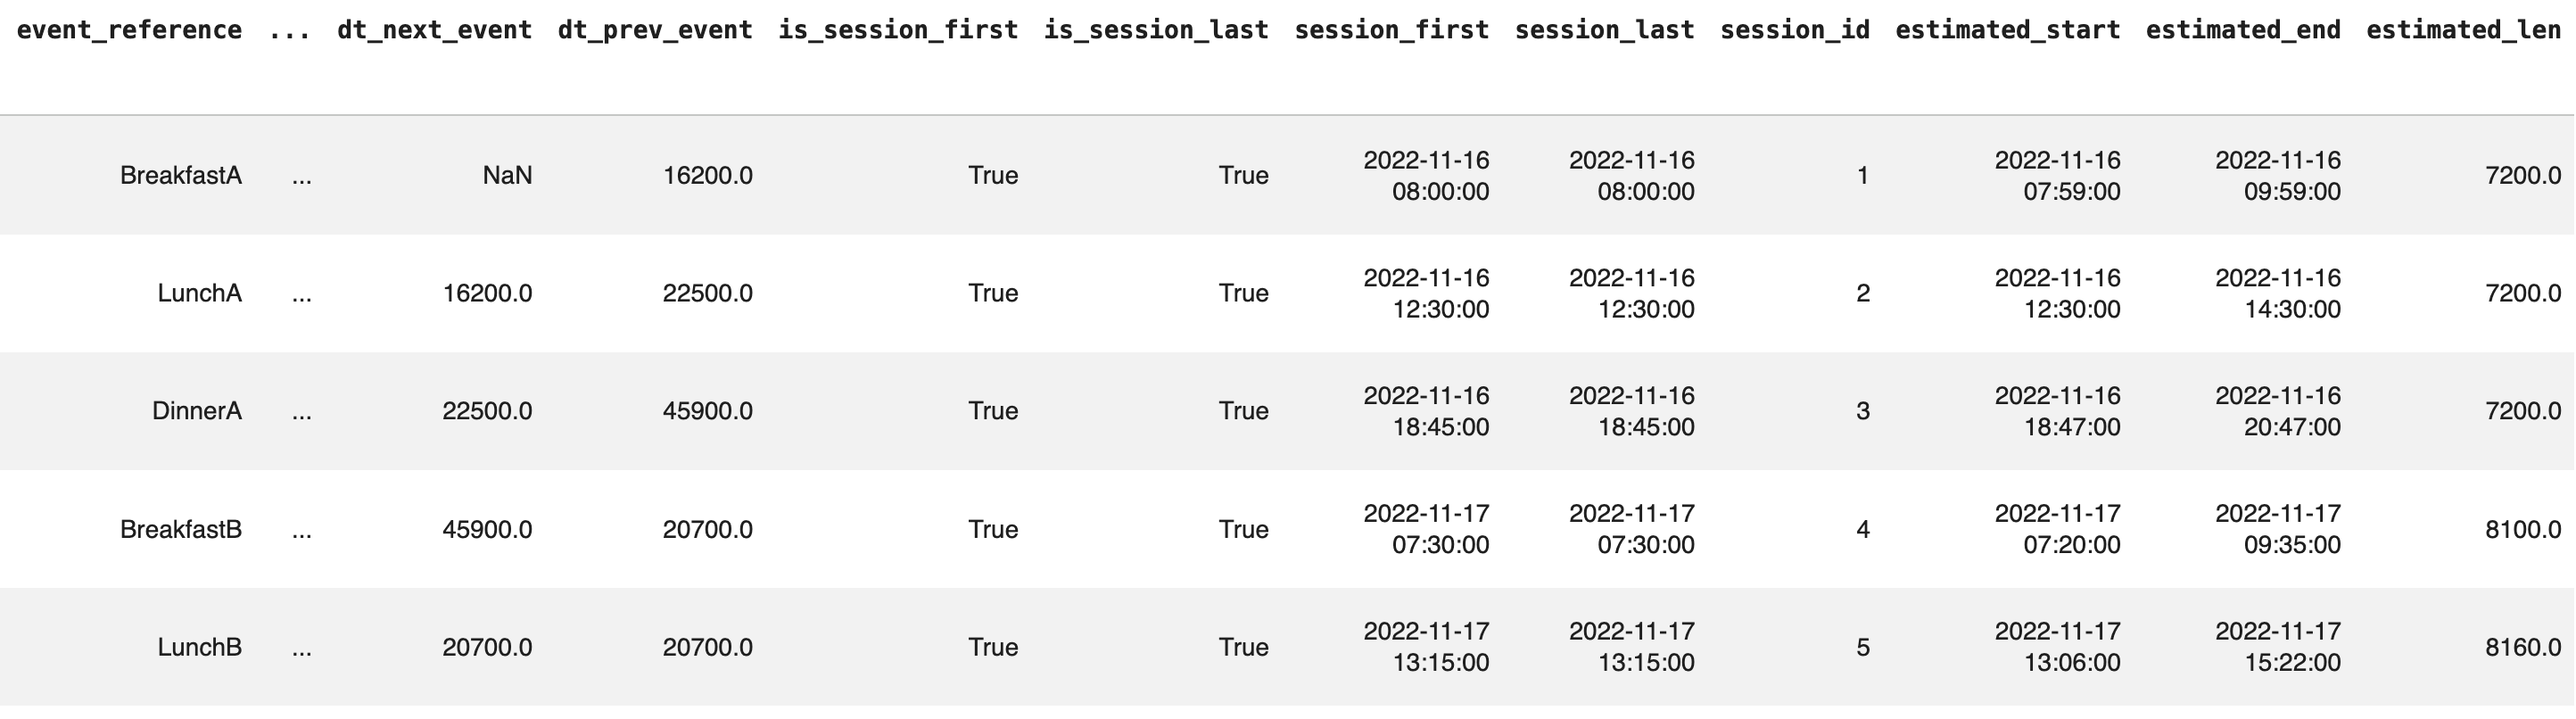
Each session has the lenght in seconds, the times for start and end etc.
And all the metrics mentioned above can be calculated for a session too (max glucose, etc.) This way we can also visualize a session:
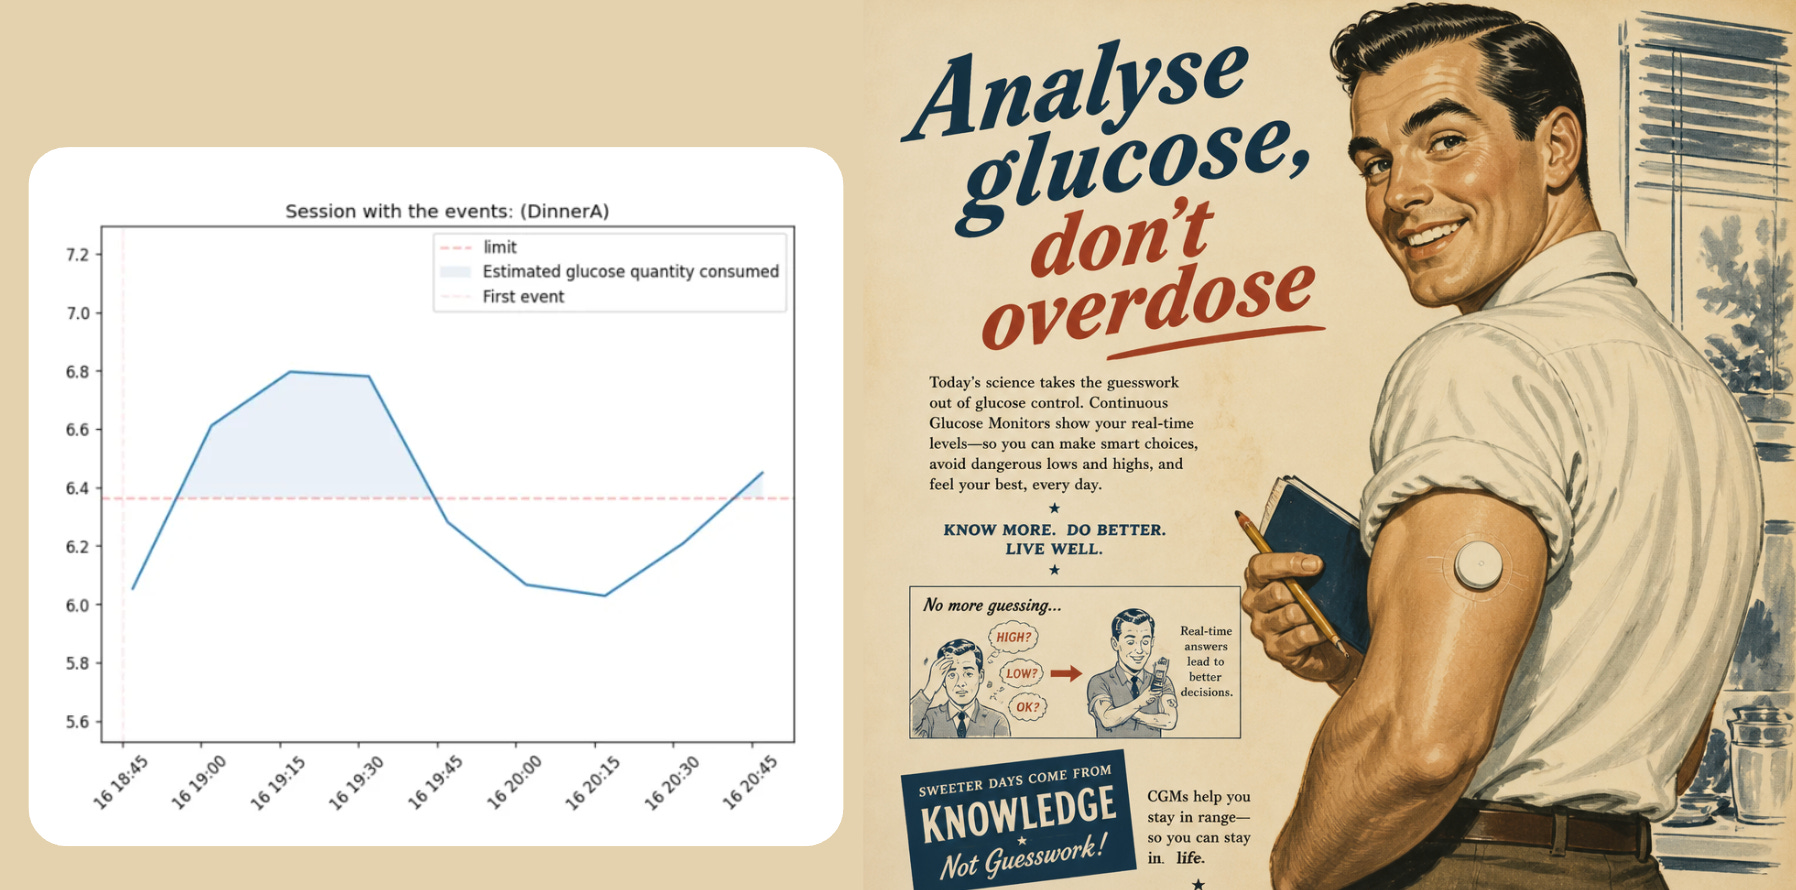
gl.plot_session_response(glucose, meal_sessions, session_id=3, use_notes_as_title=True, show_auc=True, notes_col='meal_notes')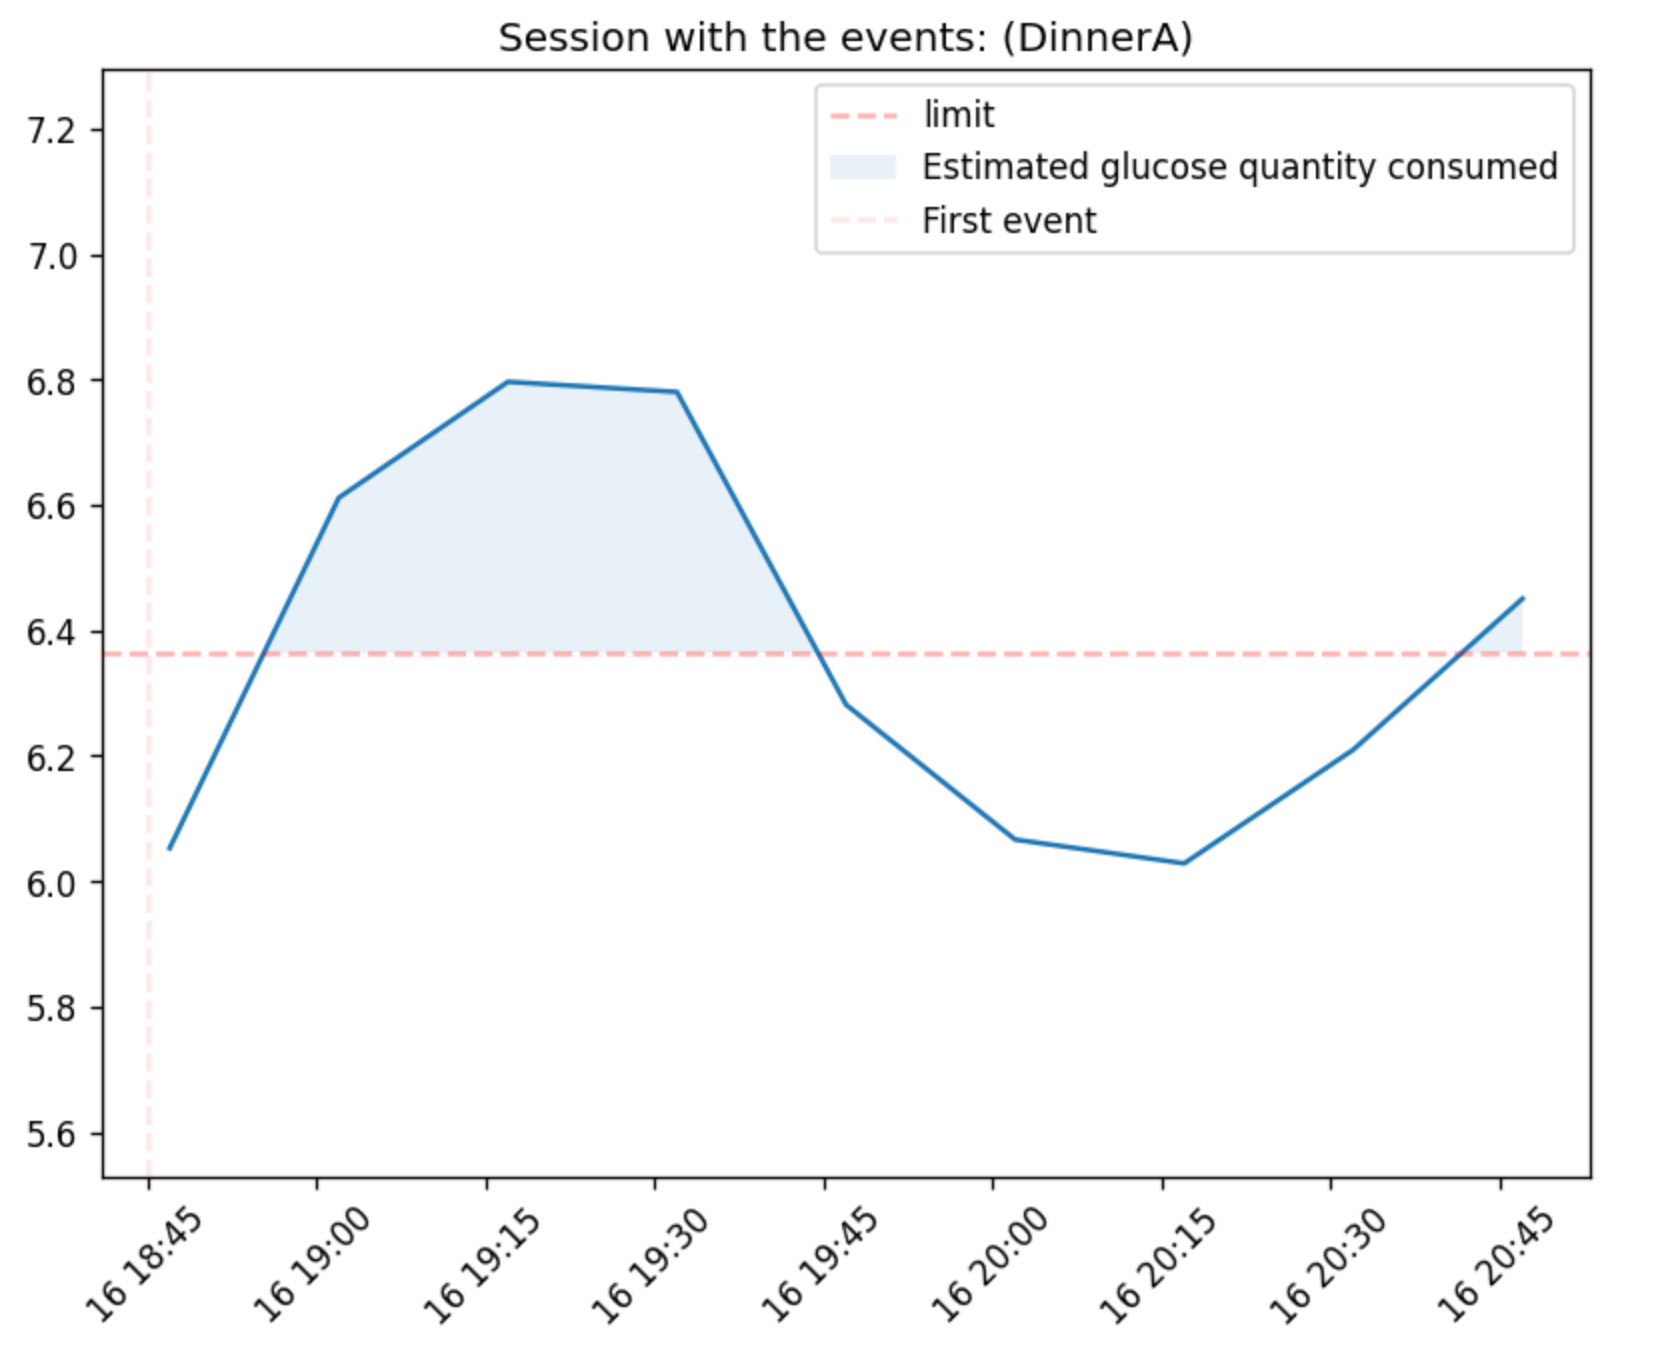
We can also compare two meal or event sessions
gl.plot_compare_two_sessions(glucose, meal_sessions, session_id_left=3, session_id_right=6, use_notes_as_title=True, notes_col='meal_notes', share_y_axis=False)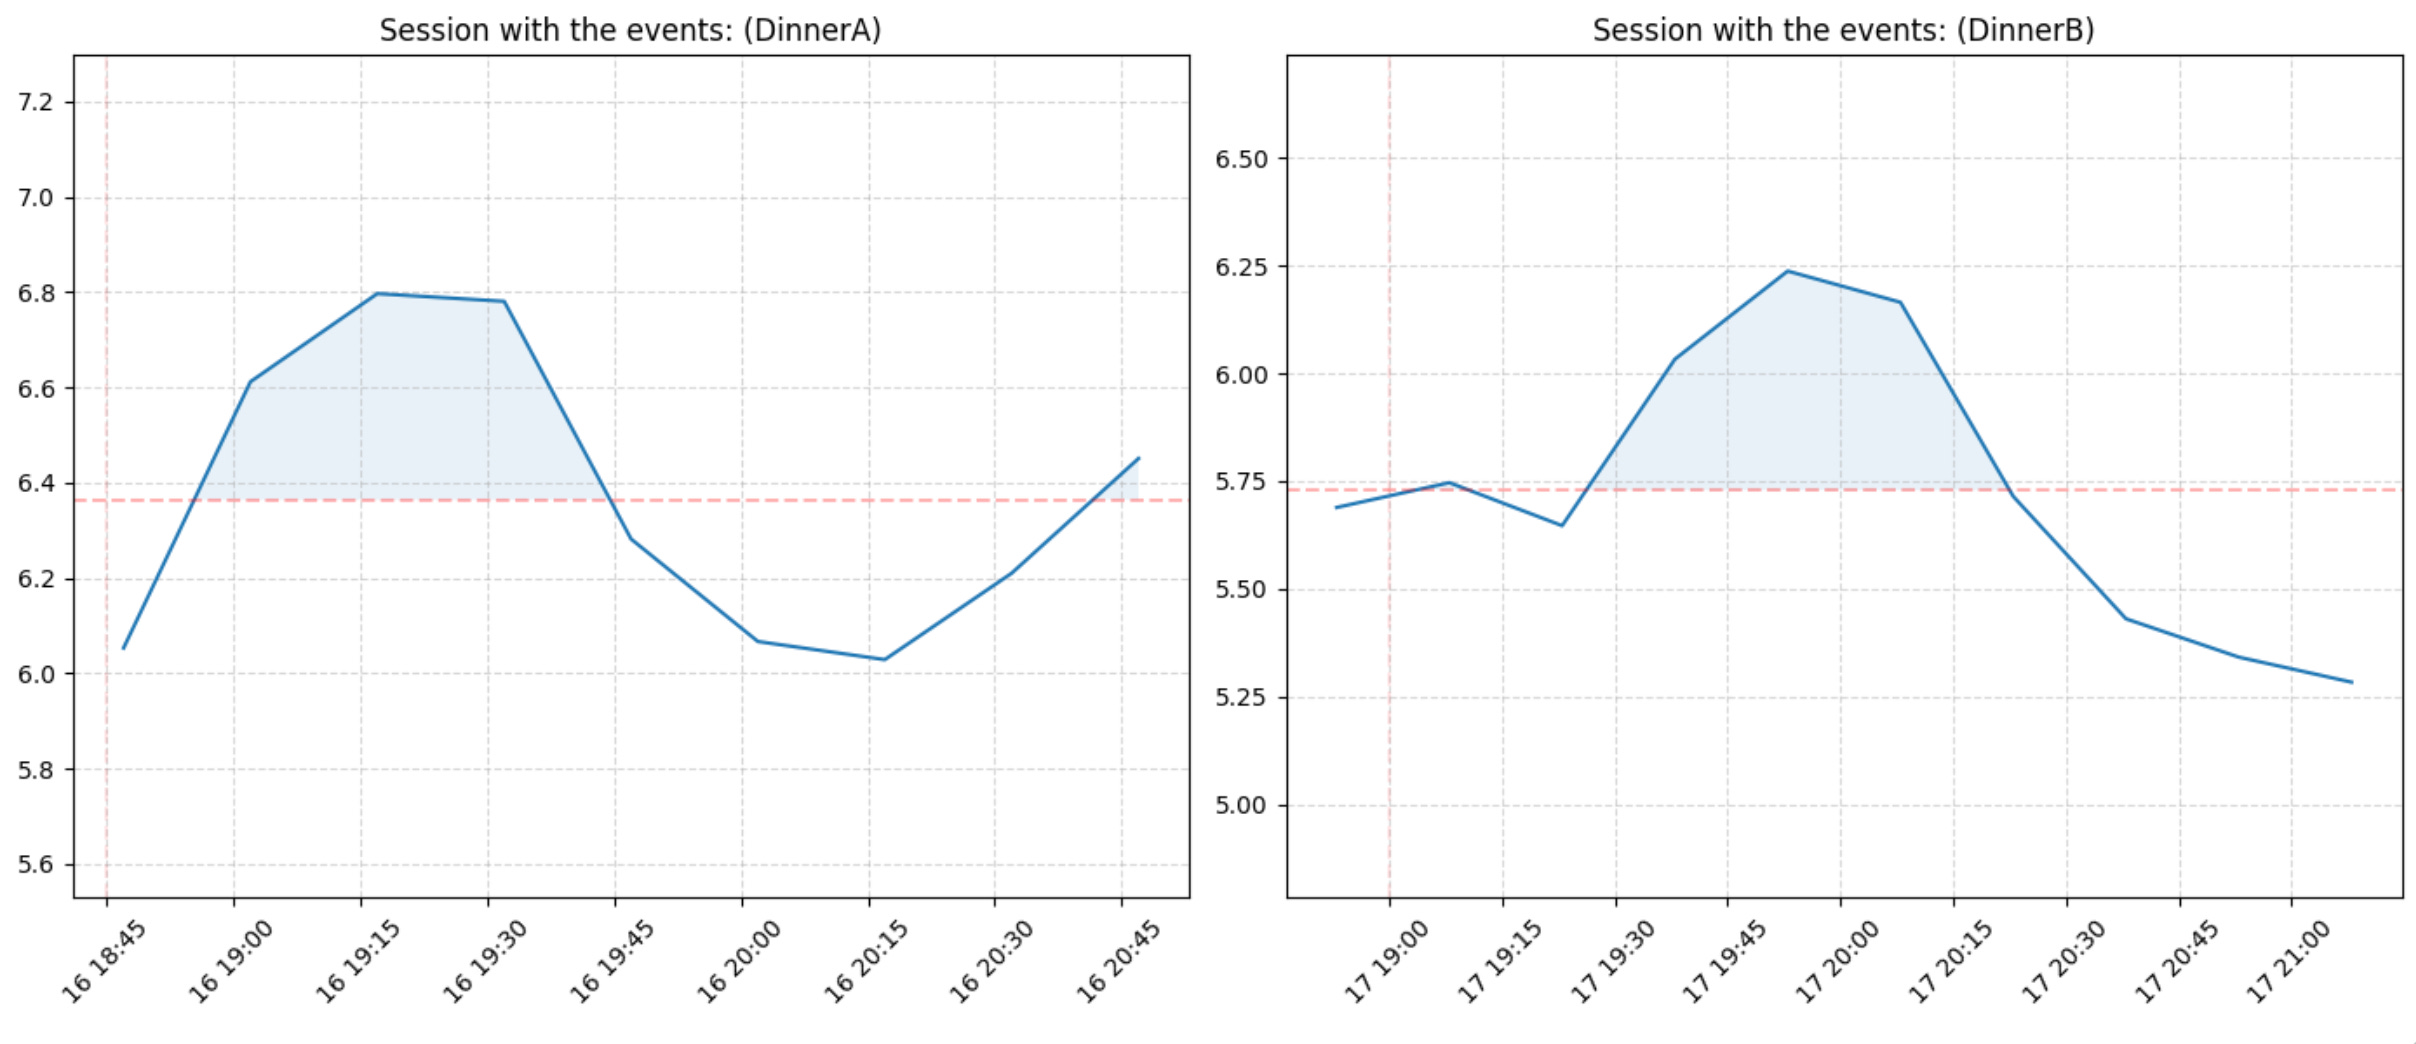
Or compare all sessions we have:
gl.plot_all_sessions(gdf=glucose, edf=meal_sessions, sessions_per_page=10, use_notes_as_title=True, notes_col='meal_notes', share_y_axis=False)Future features and limitations
Note that glyco is a work in progress, but it is a set of methods and functions I have been using myself for the past few years.
If there is enough interest in it, I will include the following soon:
Comparing glucose experiment results automatically.
Comparing a glucose data to population data.
Ranking meals and days and deeper tutorials.
Using other data types than dataframes, and handling other types of workflows.
These are all features I’ve already implemented but it would take time to publish them within glyco so I will only do so if there seems to be enough interest in it.
Some of the obvious limitations in glyco that are worth noting:
It is not a medical device and is not meant for the diagnosis or treatment of any conditions.
It is not suitable for analyzing data in a medical setting. And results should be interpreted in conjunction with other relevant clinical information.
It is not intended for use on individuals who are using insulin therapy. And it may not provide accurate results for individuals with rare or complex glucose-related conditions.
I am not an expert in anything, including glucose, biology, Python or anything you can think of. It has only been reviewed by yours truly, hopefully this post changes that.
If you want to contribute to glyco, there is a lot to do so feel free to drop me a message on any platform or directly on github.